
A low‑tech, habit‑forming tracker that reveals real deals and shrinkflation—no app required.
Grocery bills keep creeping up while sales and clever packaging leave us guessing which store actually saves us money. We needed a straightforward way to see real unit prices and sale cycles instead of trusting flashy discounts—and that’s where this little notebook comes in.
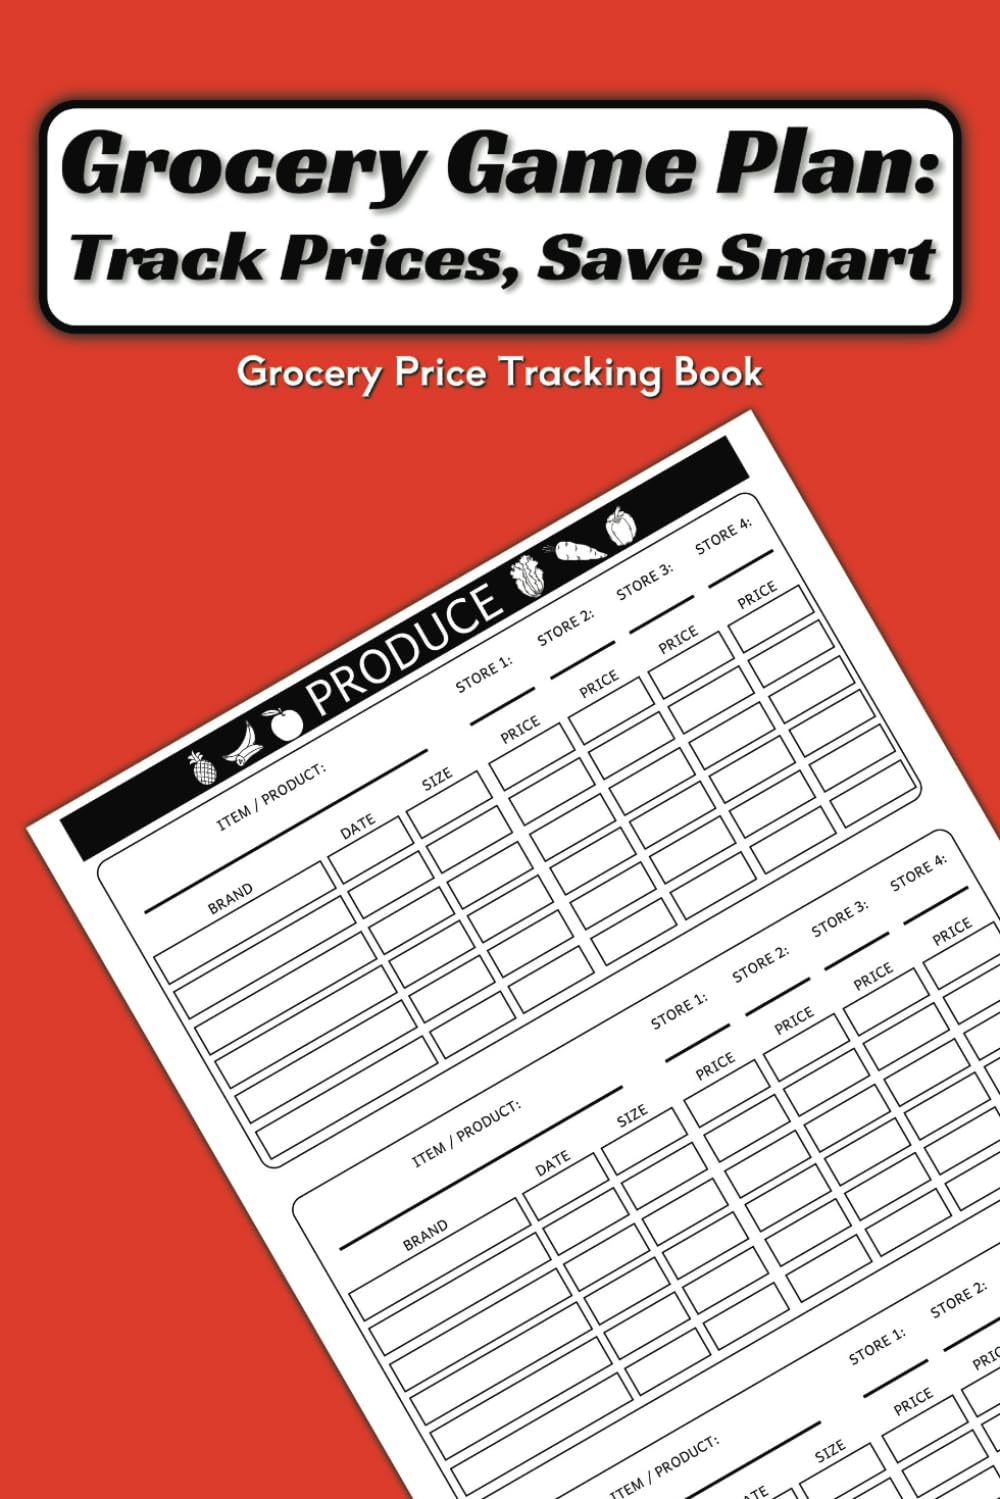
The Grocery Game Plan is a $7.99, 120‑page, 6×9 price‑tracking book designed to log base prices across stores and brands. It’s manual, yes, but that deliberate act of recording helps us spot shrinkflation, recurring sale patterns, and which items are truly worth hauling across town. In a market saturated with apps that promise instant alerts, this low‑tech option trades speed for clarity, portability, and a habit‑forming view of real savings.
Grocery Game Plan Price Tracking Notebook
We found this tracker makes price comparison approachable and habit-forming for everyday shoppers. It’s not as instantaneous as an app, but the manual process helps reveal real patterns in pricing and promotions.
Quick overview
We look at grocery budgeting as a design problem: how do you turn noisy, one-off price checks into a reliable dataset you can act on? This paperback tracker is a low-friction, analog solution to that question. The Grocery Game Plan is a 6 x 9-inch, 120-page book organized into 12 shopping categories with pre-structured spaces to record base prices across multiple stores and brands. It’s intentionally physical—no accounts, no logins—designed for people who prefer a tactile workflow or want to build a long-term, visible record of grocery prices.
Why a paper tracker still matters
Digital price-comparison tools are convenient, but they bring trade-offs: privacy concerns, app fatigue, inconsistent product mappings, and the need to rely on retailers’ data. We find that a paper-first approach addresses several of those issues in a straightforward way:
What’s inside the book
The layout is pragmatic rather than flashy. Key elements include:
How we used it (recommended workflow)
We treat the book like a living document that grows with our shopping habits. Here’s the sequence that worked best for us:
- Start by listing your top 20–30 regularly purchased items—these give you the highest return on tracking time.
- For each item record the pack size, base price (per unit where possible), and the store name.
- Update entries when you notice a sale or a package size change (shrinkflation).
- After 6–8 shop cycles, review entries to identify the consistently cheapest store for each category.
Setup checklist (what to have on hand)
How this fits into your ecosystem
We think of this book not as a replacement for digital tools, but as a complementary layer. Here’s a quick comparison that clarifies when to reach for paper vs an app.
| Attribute | Paper tracker (this book) | Price-tracking apps / browser tools |
|---|---|---|
| Setup friction | Low—open and write | Medium—install, configure, map products |
| Accuracy for local in-store deals | High (you record real receipts) | Variable (depends on data sources) |
| Privacy | High (no account needed) | Lower (often requires permissions) |
| Long-term pattern visibility | High (you keep paper history) | High (if you export or keep account) |
This table shows why we reach for the booklet when we want hands-on insight about our local stores, and use apps for scanning barcodes or quick one-off checks.
Design and user experience notes
The book leans toward function: we appreciate the clean typography, the width of the lines (which accommodates numbers and notes), and the way the category separations reduce cognitive load while shopping. The paper is thicker than average for this kind of notebook, which makes it comfortable to erase and re-record entries without the page suffering.
Visually, the layout nudges you toward unit-price thinking; dedicated fields for pack size and unit cost make it easier to compare differently packaged items. That’s important in modern grocery environments where bulk sizes, multipacks, and promotional packaging are commonplace.
Practical examples of what we discovered using it
These are the kinds of small adjustments that compound into real savings when applied consistently.
Tips to get the most value
Limitations and trade-offs
The most obvious limitation is the manual nature of the book. It requires regular attention and habit-building. If you prefer automated price scraping, barcode scanning, or integration with grocery list apps, this notebook won’t replace those workflows.
There’s also a structural limit—the pages provide columns for up to four stores and six brands per item. That covers the average household but may be constraining if you bounce between many specialty stores or buy many brand variants.
Who should buy this
We recommend this for methodical shoppers who want a low-tech, high-clarity way to understand where they’re actually saving money. It’s also ideal for people who prefer privacy, for households tracking splitting costs, and for anyone trying to detect shrinkflation or deceptive sale tactics.
Final takeaways
The Grocery Game Plan is a thoughtful, no-nonsense tool that nudges grocery shopping toward a data-driven practice without the friction of accounts or apps. We value it not because it’s revolutionary, but because it’s disciplined: it helps people form a better relationship with prices, promotions, and the habits that shape their grocery spend. If you’re willing to invest a little time each week, it’s a cheap, durable way to turn grocery curiosity into measurable savings.
FAQ
Paper and apps solve different problems. We use the paper tracker for local, in-store reality checks and long-term patterns—things apps sometimes miss or mis-map. Apps are great for barcode scanning and instant lookup, but the tactile act of recording prices manually often leads to better awareness and fewer hidden surprises.
Start small: 10–30 frequently bought items will give you the best payoff for the time spent. Those are the purchases where small price differences compound quickly. Once the habit sticks, add more items seasonally or by category.
Yes. Because the layout encourages recording both pack size and unit price over time, you can spot when the package size drops but the price stays the same—an effective way to catch shrinkflation early.
We prefer a mechanical pencil or an erasable pen—both allow corrections without messy crossings. A thin highlighter for marking anomalies is also handy.
Treat the notebook as your primary qualitative ledger and use apps for quick scans or barcode lookups. Periodically, we summarize trends from the book into a simple spreadsheet if we want charts or shared access.
For seasonal items (berries, turkeys, grilling essentials) it’s particularly useful—seasonality changes prices and tracking multiple seasons will show you the best buy windows. For single-ingredient staples we track only if they’re bought frequently or show erratic pricing.

Chris is the founder and lead editor of OptionCutter LLC, where he oversees in-depth buying guides, product reviews, and comparison content designed to help readers make informed purchasing decisions. His editorial approach centers on structured research, real-world use cases, performance benchmarks, and transparent evaluation criteria rather than surface-level summaries. Through OptionCutter’s blog content, he focuses on breaking down complex product categories into clear recommendations, practical advice, and decision frameworks that prioritize accuracy, usability, and long-term value for shoppers.